An interview with artist and writer
Tom Corby
December 14th 2021. Melissa Sterry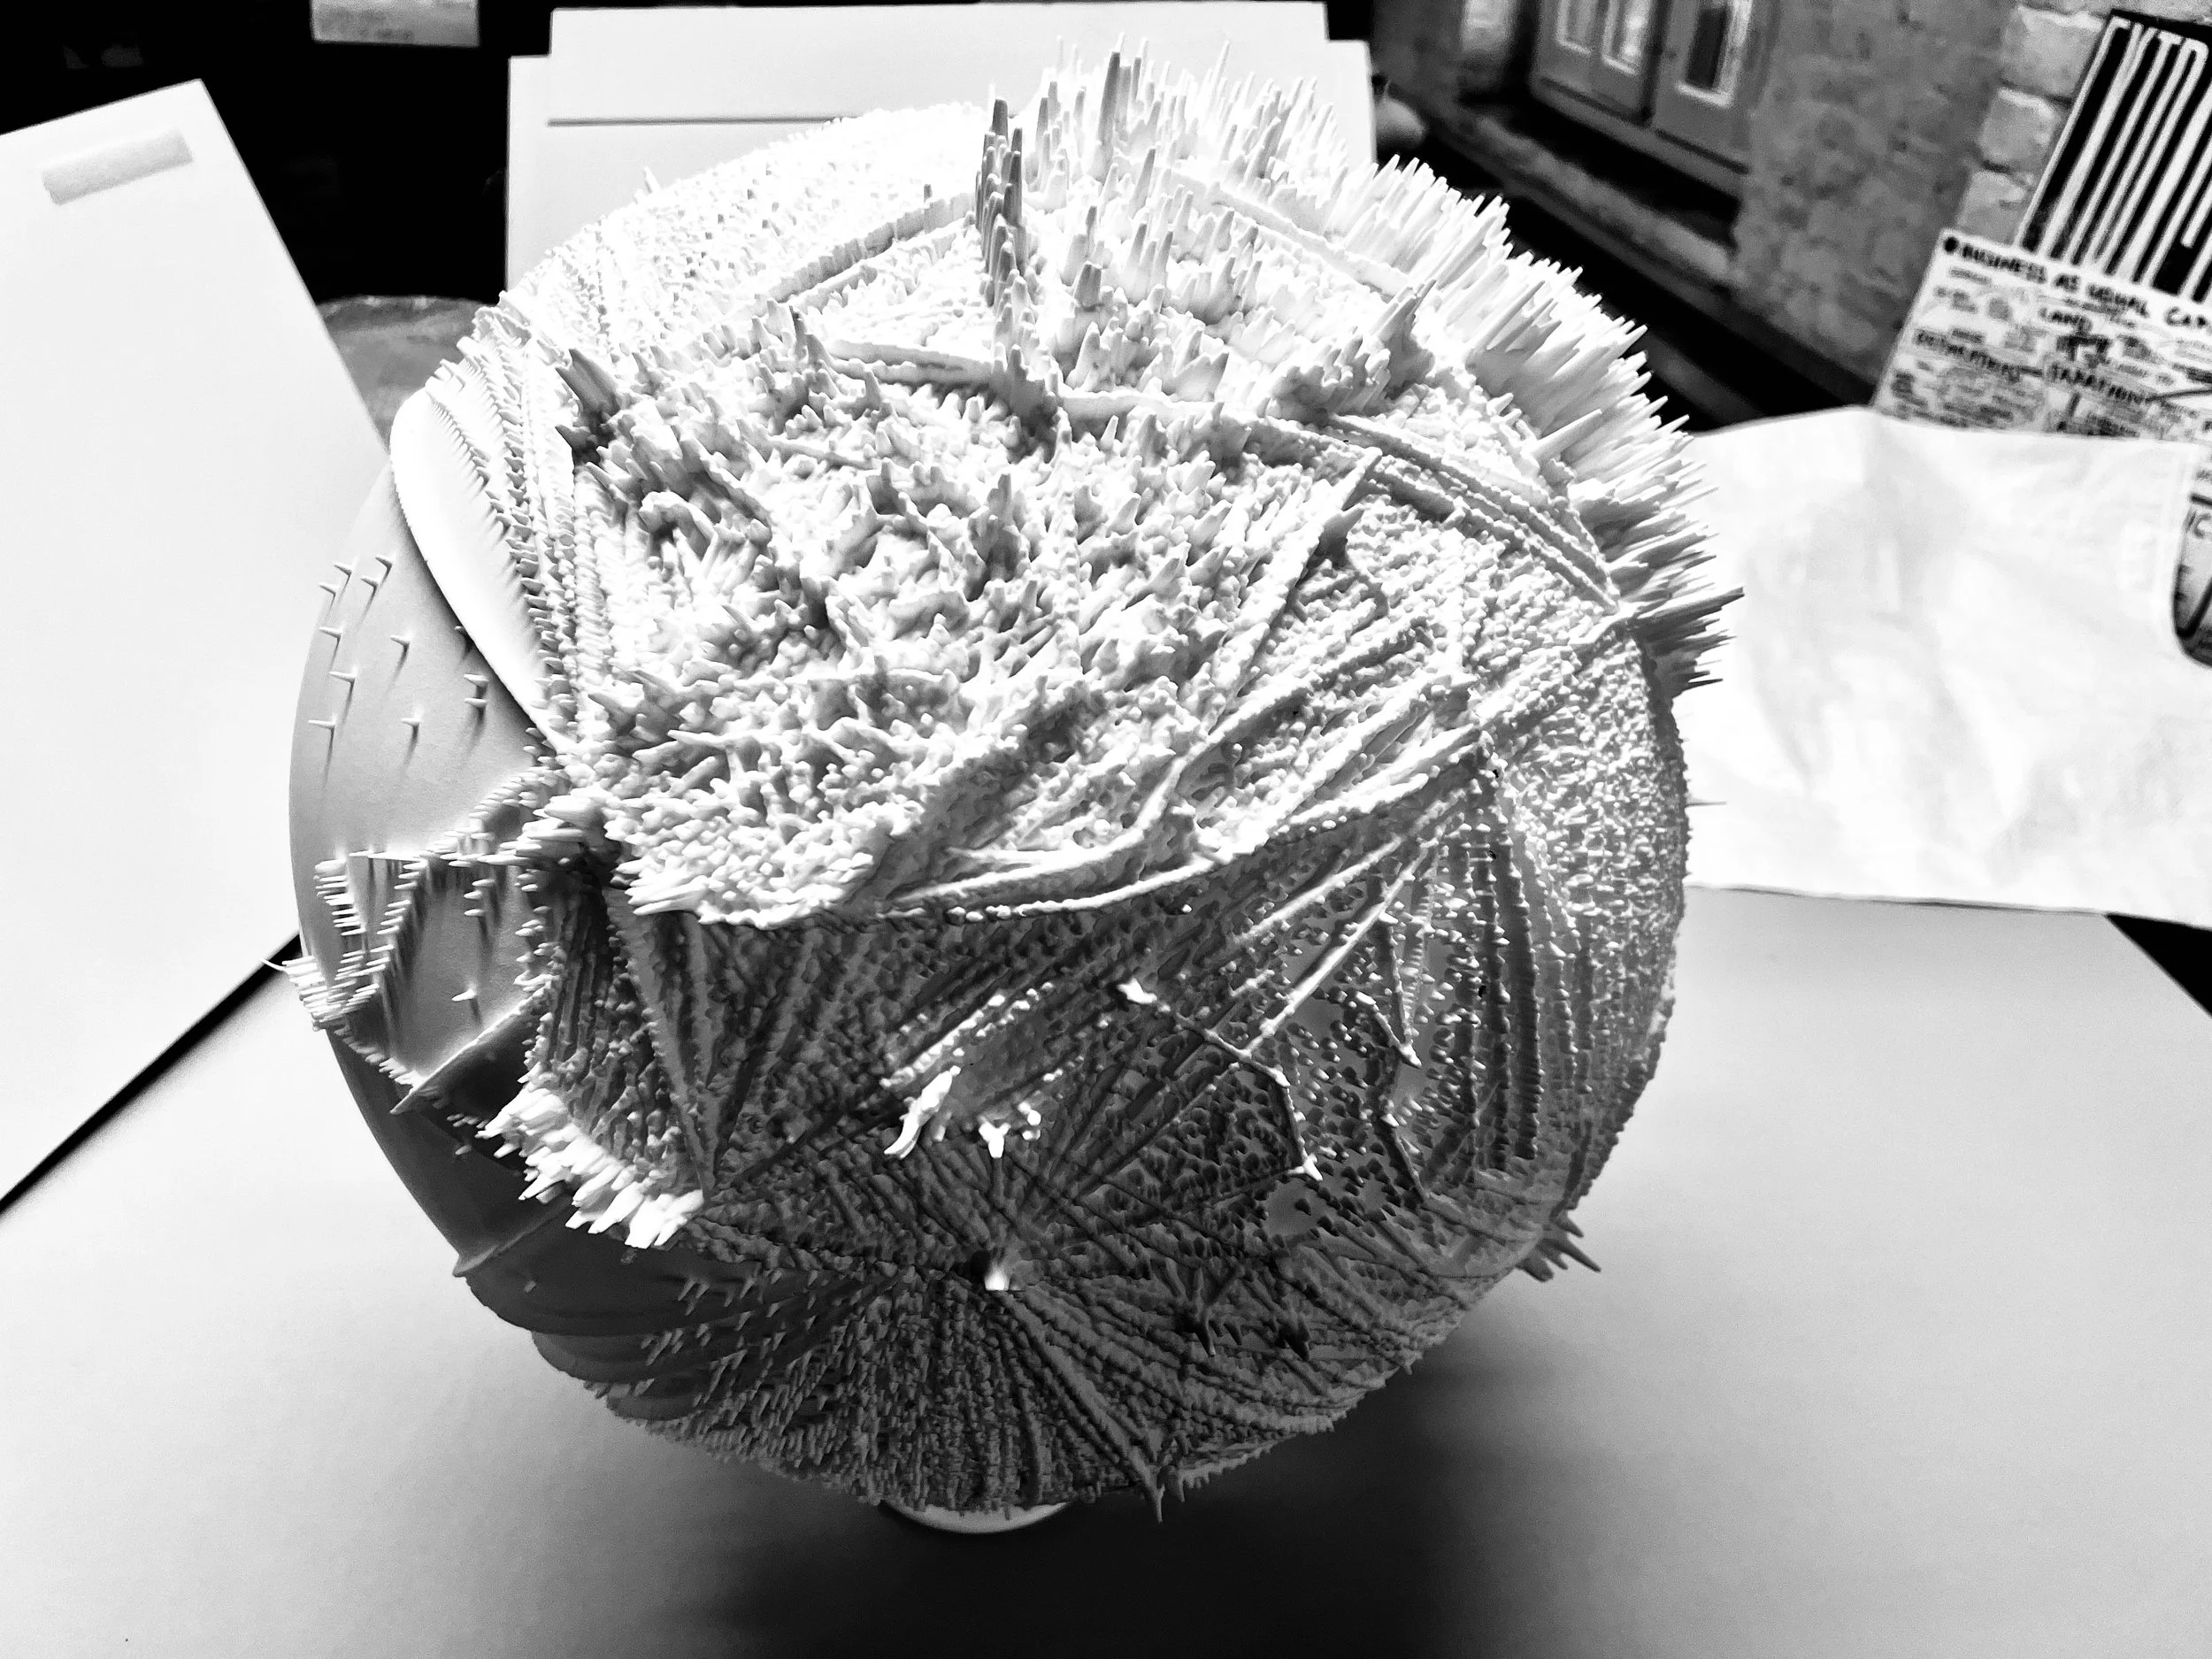
Professor Tom Corby is currently principal investigator on the Arts and Humanities Research Council funded Materializing Data Project at the Manifest Data Lab at Central Saint Martins, where he leads a team including Jonathan Mackenzie, Gavin Baily, Louise Sime, Erin Dickson, Giles Lane, Rachel Jacobs, and George Roussos. Their work explores how to make tangible the relationships between environmental, social and technological worlds and is a collaboration with the British Antarctic Survey. Here Tom shares insights on the role of visual arts and media in understanding the complex challenges we face…
MS: Your research proposes that just as we experience our climate physically through immersion in landscapes and weather, our engagement with climate change might change if we similarly encountered its information and data in physical forms. How is your project exploring this possibility?
TC: Climate data captures complex phenomena in the world which describe vast geological timescales, atmospheres, biotics and other planetary phenomena. These link to human, political, and social behaviors in ways that are hard to grasp even if their effects are catastrophically present. The complex abstractions of climate change make communication of it difficult and this is doubled through technical, visual and statistical approaches which also operate as bulwarks of specialist expertise that constrict more public participatory modes of engagement. Addressing this communication gap was one of the core motivating factors for our project and doing using approaches that explore the potential of climate data to operate in sensory ways is the method we employ.
To go further, we believe that the patterns revealed in climate data can, to paraphrase Hanna Knox help us ‘think like a climate’, that is motivate a shift in understanding of how we are bound to other people, species, organisms and atmospheric realities. So, rather than think of climate data as numeric and cognitive knowledge, we approach it as a form of patterning that diffracts elements of the environment back to us, and from which we can draw out physical forms, events and encounters that capture something of its properties.
We are also interested in how climate data can ‘operate in the wild’, outside of laboratory enclosures in messy physical and public ways. When we use the term ‘physically’ we mean both in a tactile and material sense, but also through immersive encounters that engage the body, and through our public workshops that tease apart issues around experiences of climate with local communities. The physical then is a literal concept, an embodied sensibility and a social and physical coming together.
To give some examples, we recently projected a large animation of historic CO2 emissions in a ‘guerrilla’ operation on the sides of The Houses of Parliament and Tate Britain, We have been printing large 3D prints of what we call ‘necrotopologies’ that show how fossil fuel emissions have physically remade the atmosphere, and at the recent COP26 conference we distributed ‘Little Earths’ to members of the public to care for. These are small hand-held models derived from climate model data, and the people we give them to we call ‘custodians’ who are tasked care for them in their day-to-day lives and document their reflections in diary form.
In summary, we hope to demonstrate the potential of climate data as a mobile and social form that when used in public contexts, sites and in physical forms can operate to motivate reflection
MS: When examining the spatiotemporal patterns in global greenhouse gas emissions, did you observe any patterns in the emissions from wildfires, and if so what were they?
TC: This is a really interesting question as it brings to the fore how the boundaries between creative work and scientific approaches becomes blurred in intradisciplinary work.
One of the data sets we have used is from CMIP6 (the Coupled Model Intercomparison Project) which brings together the latest climate model outputs from around the world and it is this information that has fed the latest IPCC report and that underpins many of the discussions at the latest COP in Glasgow. When we first started digging into it in November 2019 there was a sudden uptick in the prevalence of forest fires in the Amazon rainforest, Australian bush and other places, so we were naturally drawn to parts of the CMIP data that capture this.
Yesterday I was asked what the difference was between our work and for example, scientific visualisations, and I think these forest fire models and animations are a good example of this. Artists operate with a sensibility informed by visual culture and critical debates which means they can connect ideas transversally to develop representations that a pure science-based approach wouldn’t consider. For example, the data captures on a monthly and yearly level the density of CO2 arising from these disasters, but does not really show in a tangible sense, how forest fires are remaking the atmosphere. When we first started to physically model and animate this data it was grimly fascinating as we were seeing for the first time how the plume formations arising from the fires were girdling the Earth as kind of material evidencing of disaster. The 3D models in particular produce a kind of visceral shock because the material structure of atmospheric change wrought by the fires is bought into the same sensory space as the viewer. This I think produces a recognition of something that we know is going on but we aren’t mindful of it because it is invisible and exists beyond human scale.
MS: A project situated at the interface of art and science, describe some of the challenges you faced when researching and developing the work, and some of the ways in which you addressed those challenges.
TC: We started collaborating with the British Antarctic Survey in 2007. This led to a series of data driven installations about Antarctica and later on the Arctic. What we learnt from this is that it is very difficult to come to this topic without having a detailed understanding of the science of climate change, and the technological platforms that underpin and model the data. The phrase ‘climate science’ is also a bit of a misnomer (scientists prefer Earth Systems Science) as it makes it sound like one discipline when really it’s a mosaic of many different specialisms and even climate scientists struggle to grasp the entire range of disciplines that make up the field.
In addition, climate science rubs up against the social and political in really interesting ways, for example in how the IPCC works and the function of the COP (or otherwise). This public/cultural/political interface is also really important to understand as it reveals pressure points in the public understanding of science and also (from my perspective) demonstrates that it’s not possible to carry out neutral science without avoiding the politics, although many of the scientists I know would disagree with this.
These are significant challenges, and require careful study of the scientific literature, practical exploration of code and data platforms, and many conversations with specialists; even now after 15 years I still struggle. Additionally, not least from my perspective, is the psychological impact of being completely immersed in debates and information that paint a pretty bleak picture of where we are heading.
In respect of making the artworks, we would engage in several months of research into data and climate models and then settle on one particular aspect whether that be the Southern Ocean or historic atmospheric conditions such as in these current works. Breaking off one small element makes the process of research and development more manageable, but even this description elides the difficulty of the process. At the MDL we bought together a transdisciplinary team to alleviate these issues incorporating, artists, climate scientists, computer scientists and academics. This kind of collective activity is essential in my view, but it also brings complexity in respect of building shared understandings and languages which brings us to your next question.
MS: In my experience, language barriers between disciplines is one of the biggest issues that both individuals and communities of researchers and practitioners working transdisciplinary need to overcome. How do you see visual data helping those at the interface of different fields and industries overcome those barriers?
TC: Visual communication can help cut through complexity and this can help in certain situations, Deborah Lupton talks about how information unfolds viscerally into the world using the term ‘sense data’. I really like this as it emphasises ‘knowing’ as an embodied and sensory process and in transdisciplinary environments is a good ‘teaching moment’ when talking to other disciplines that there are other ways of understanding the world beyond the cognitive and analytical.


MS: Thinking to the data your project presents, how visible do you think that data and its possible implications are within wider society both in and beyond the Global North?
TC: This is the most important question of our times, I won’t be able to do it the justice it deserves.
The scientific data of climate change, while developing vital insights into our changing environment, offer partial views of wider social and environmental processes which, as just demonstrated at COP26, can result in climate policies that are unequal. There is an urgent need to integrate wider experiential and indigenous traditions into the production of climate knowledge to develop more socially just approaches to policy generation. We directly addressed this in the guerrilla projection we staged on the House of Commons that shows how the build-up of CO2 and other greenhouse gases has radically altered the Earth’s atmosphere. The work maps from the industrial revolution to the present day the regions contributing most to the climate crisis, beginning with the UK in the 1750s. It shows how the Global North is responsible for 92% of CO2 with 8% coming from the Global South. The spread of CO2 described in the animation mirrors the wider historic processes of power distribution and inequity visited on the Global South and shows that the atmosphere is as contested and exploited a space as the territories beneath it. Works like these can produce new visibilities for climate knowledge that can motivate reflection and awareness of the links between climate change, exploitation and exclusion.
We have also been working with historic climate archives that show how the temperature gauges in India were put in place as part of colonial infrastructure projects. The historic information that these gauges collected is still used in contemporary climate modelling, which brokers really interesting questions about how these technological models also mirror and incorporate the effects of colonial power. Technology is always social and political.
MS: One of the great concerns within the scientific and wider STEM community of the past several years has been the lag between the speed at which the climate is changing and the speed at which society is responding to that change. What role do you think art has to play in mobilising action on climate change and environmental issues more generally?
TC: I think I’ve touched upon this above, but there are a number of ways that art can mobilise change and central to this is its ability to create experiential routes to grasping complex issues which can motivate reflection leading to action.
However, we have to acknowledge that the term ‘art’ itself is a complex and contested one. There are many artworlds, and many different kinds of artist so I think we need to consider a range of processes that operate within a field of shared concerns. We also have to emphasise that the ‘mainstream’ artworld with its connections to big business and promotion of ‘art stars’ is not well placed to lead on this. I see students at Central Saint Martins and elsewhere taking the lead in developing new inclusive approaches to tackling this crisis. There are nascent cultures emerging that place centrally the multifaceted experience of climate crisis, diversity and an awareness of the need for solidarity and this gives me great hope and some of this is discussed below.
MS: Associate Dean of Research at Central Saint Martins, describe what steps CSM and UAL more generally are taking to ensure that the research their staff and students produce might help not hinder the climate and wider environmental crisis?
TC: Three years ago, we instigated the CSM Climate Emergency Assembly where students and staff together developed a list of demands towards radical change in the teaching curriculum, carbon neutrality in everything we do, zero waste, and divestment. This has subsequently informed the University strategy on these issues and is leading a complete reinvention of everything we do with carbon literacy and equality being integral to all teaching, learning and research activity. A public face to these changes is very important and in November this year in parallels with COP26, we held the first of what will be an annual ‘Carnival of Crisis’ that united all the colleges at UAL in a student led march through central London, art events performances and screenings.
This isn’t just box ticking it’s a radical change in what an Art and Design education can be and a recognition that institutions like CSM shouldn’t simply be ‘responsive’ but need to proactively set the agenda for climate action. It’s the beginning of something, it won’t be easy, but it is an absolute necessity. In respect of the MDL I look forward to seeing how our research feeds into the curricula. We’ve had a lot of interest from students across all courses in our work.
MS: What do you think are the biggest barriers to enabling researchers and practitioners to tackle the climate crisis?
TC: The big structural stuff sets the backdrop that enables or inhibits so much of what we need to do as researchers, teachers and students. This includes the power of big oil and coal, finance, and of course the ongoing and enduring legacy of inequality. Achille Mbembe has a great phrase for this type of corrosive block ‘necropolitics’.
On the individual level, student fees frame education through an extractivist lens; everything becomes a transaction. Careering changes in technology also encode the legacies of mastery and violence that exclude ‘others’ and devastate the more-than-human world. In a context of ‘post truth’, data and artificial intelligence have damaged trust in our institutions and politics. There is an urgent need to scrutinise and understand these systems more broadly and our own complicity with them. It’s an unpromising backdrop and difficult but must be faced.


MS: Thinking to your peer group, and to those exploring creative ways to tackle the climate crisis, which projects give you hope for the future and why?
TC: There are a number of people at UAL who have been working with these issues for several years like Lucy Orta, Helen Storey, David Cross, Andrea Zimmerman, Jeremy Till amongst many others. This generation of artist, designers and thinkers has set some of the groundwork for a possible future culture, in their development of intradisciplinary art-science connections, their work on the natural environment, and the politics and financing of climate change.
Outside of UAL, John Akomfrah is doing work that knits the legacies of colonialism with climate crisis, Tomás Saraceno is also a very thoughtful practitioner who assembles interdisciplinary collectives to focus on atmospheric conditions. Younger artists such as Tabita Rezaire, Jol Thoms, Sascha Engelman and Zadie Xa are working on climate justice, decolonialism and possible futures that give me hope that we can chart a way out of the terrible mess we are in.
The role of collectives is also important, as mentioned above, we need to ditch the ‘star system’ idea of what an artist or designer is - it’s part of the problem as it’s exclusionary.
Some good examples of collectives working in this area would include Monsoon Assemblages and also The Wretched of the Earth, both of which take different approaches to the need for collaborative and interdisciplinary thinking in this area.
MS: We met on a British Council backed Future Cities lab in India in 2014, it being a research project that compelled its participants to think deeply about how critical environmental and social issues impact on future urban spaces and their resident communities. Casting your mind to that same subject - to future cities – describe the progress you hope to see by 2030?
TC: It was a well-intentioned lab, but also a symbol of failure in that some of the worst outcomes of the climate crisis we were trying to imagine have arrived, particularly in the Global South. A case in point, two years ago, Chennai - a city of 9 million people - ran out of water and was 2 days from a complete evacuation.
I was talking to Andy Haynes recently, Professor of Environmental Change and Public Health, London School of Hygiene. He is doing work in India studying how increased heat levels are impacting on the ground and in some areas are already nearing ‘wet bulb’ temperatures. It’s hard to imagine 2030 in this context. I would hope that we have achieved a global temperature of around 1.5 degrees, but after COP26 I’m pessimistic.
In respect of future urban conditions, the progress I hope to see is that emission inventory projects that evidence changes on the ground increase their resolution at city level locales and that civic society can contribute to data collection. This provides the base for evidence-based decisions fundamental to planning urban futures which also factor in lives on the ground, and from this, we can develop mitigation spaces and approaches that are locally situated. I would hope to see significant changes in how energy, transport, construction, planning and civil society operate and collaborate. However, none of this will matter if we can’t get our politicians to become systems thinkers.
MS: In a year when we are all too aware of how under-represented some perspectives on our possible futures are, which 3 individuals researching how we might address the climate crises and its possible implications would you like to champion and why?
TC: There are so many people I could mention, but the following people have all found a way of bringing the abstractions of climate catastrophe together with social, material and personal domains, in ways that are imaginative, intradisciplinary and absolutely necessary for our thinking and making in the current moment.
Tabita Rezaire is a former CSM student who amongst other work maps the relations between the transatlantic slave trade, technology and the environment. What I like about this work is the richness of the scientific imaginary it explores and the links it makes with suppressed histories.
Gopal Dayaneni is very active in thinking through the consequences of how we develop our social relationships and care for each other in the context of climate change. This work is important as the interpersonal is not often discussed in relation to climate crisis, but it is a fundamental building block of change.
Marcia Bjornerud on geological thinking, Earth System complexity and ‘timefulness’. I have a fascination with geology and this research situates us directly within the ‘other’ of geological structure and helps develop a sense and appreciation of our proximity to it.
Astrida Neimanis articulates the relationships between bodies, water and weather, to develop ideas around care and responsibility in at time of climate catastrophe.
Images :
[Top and Middle]
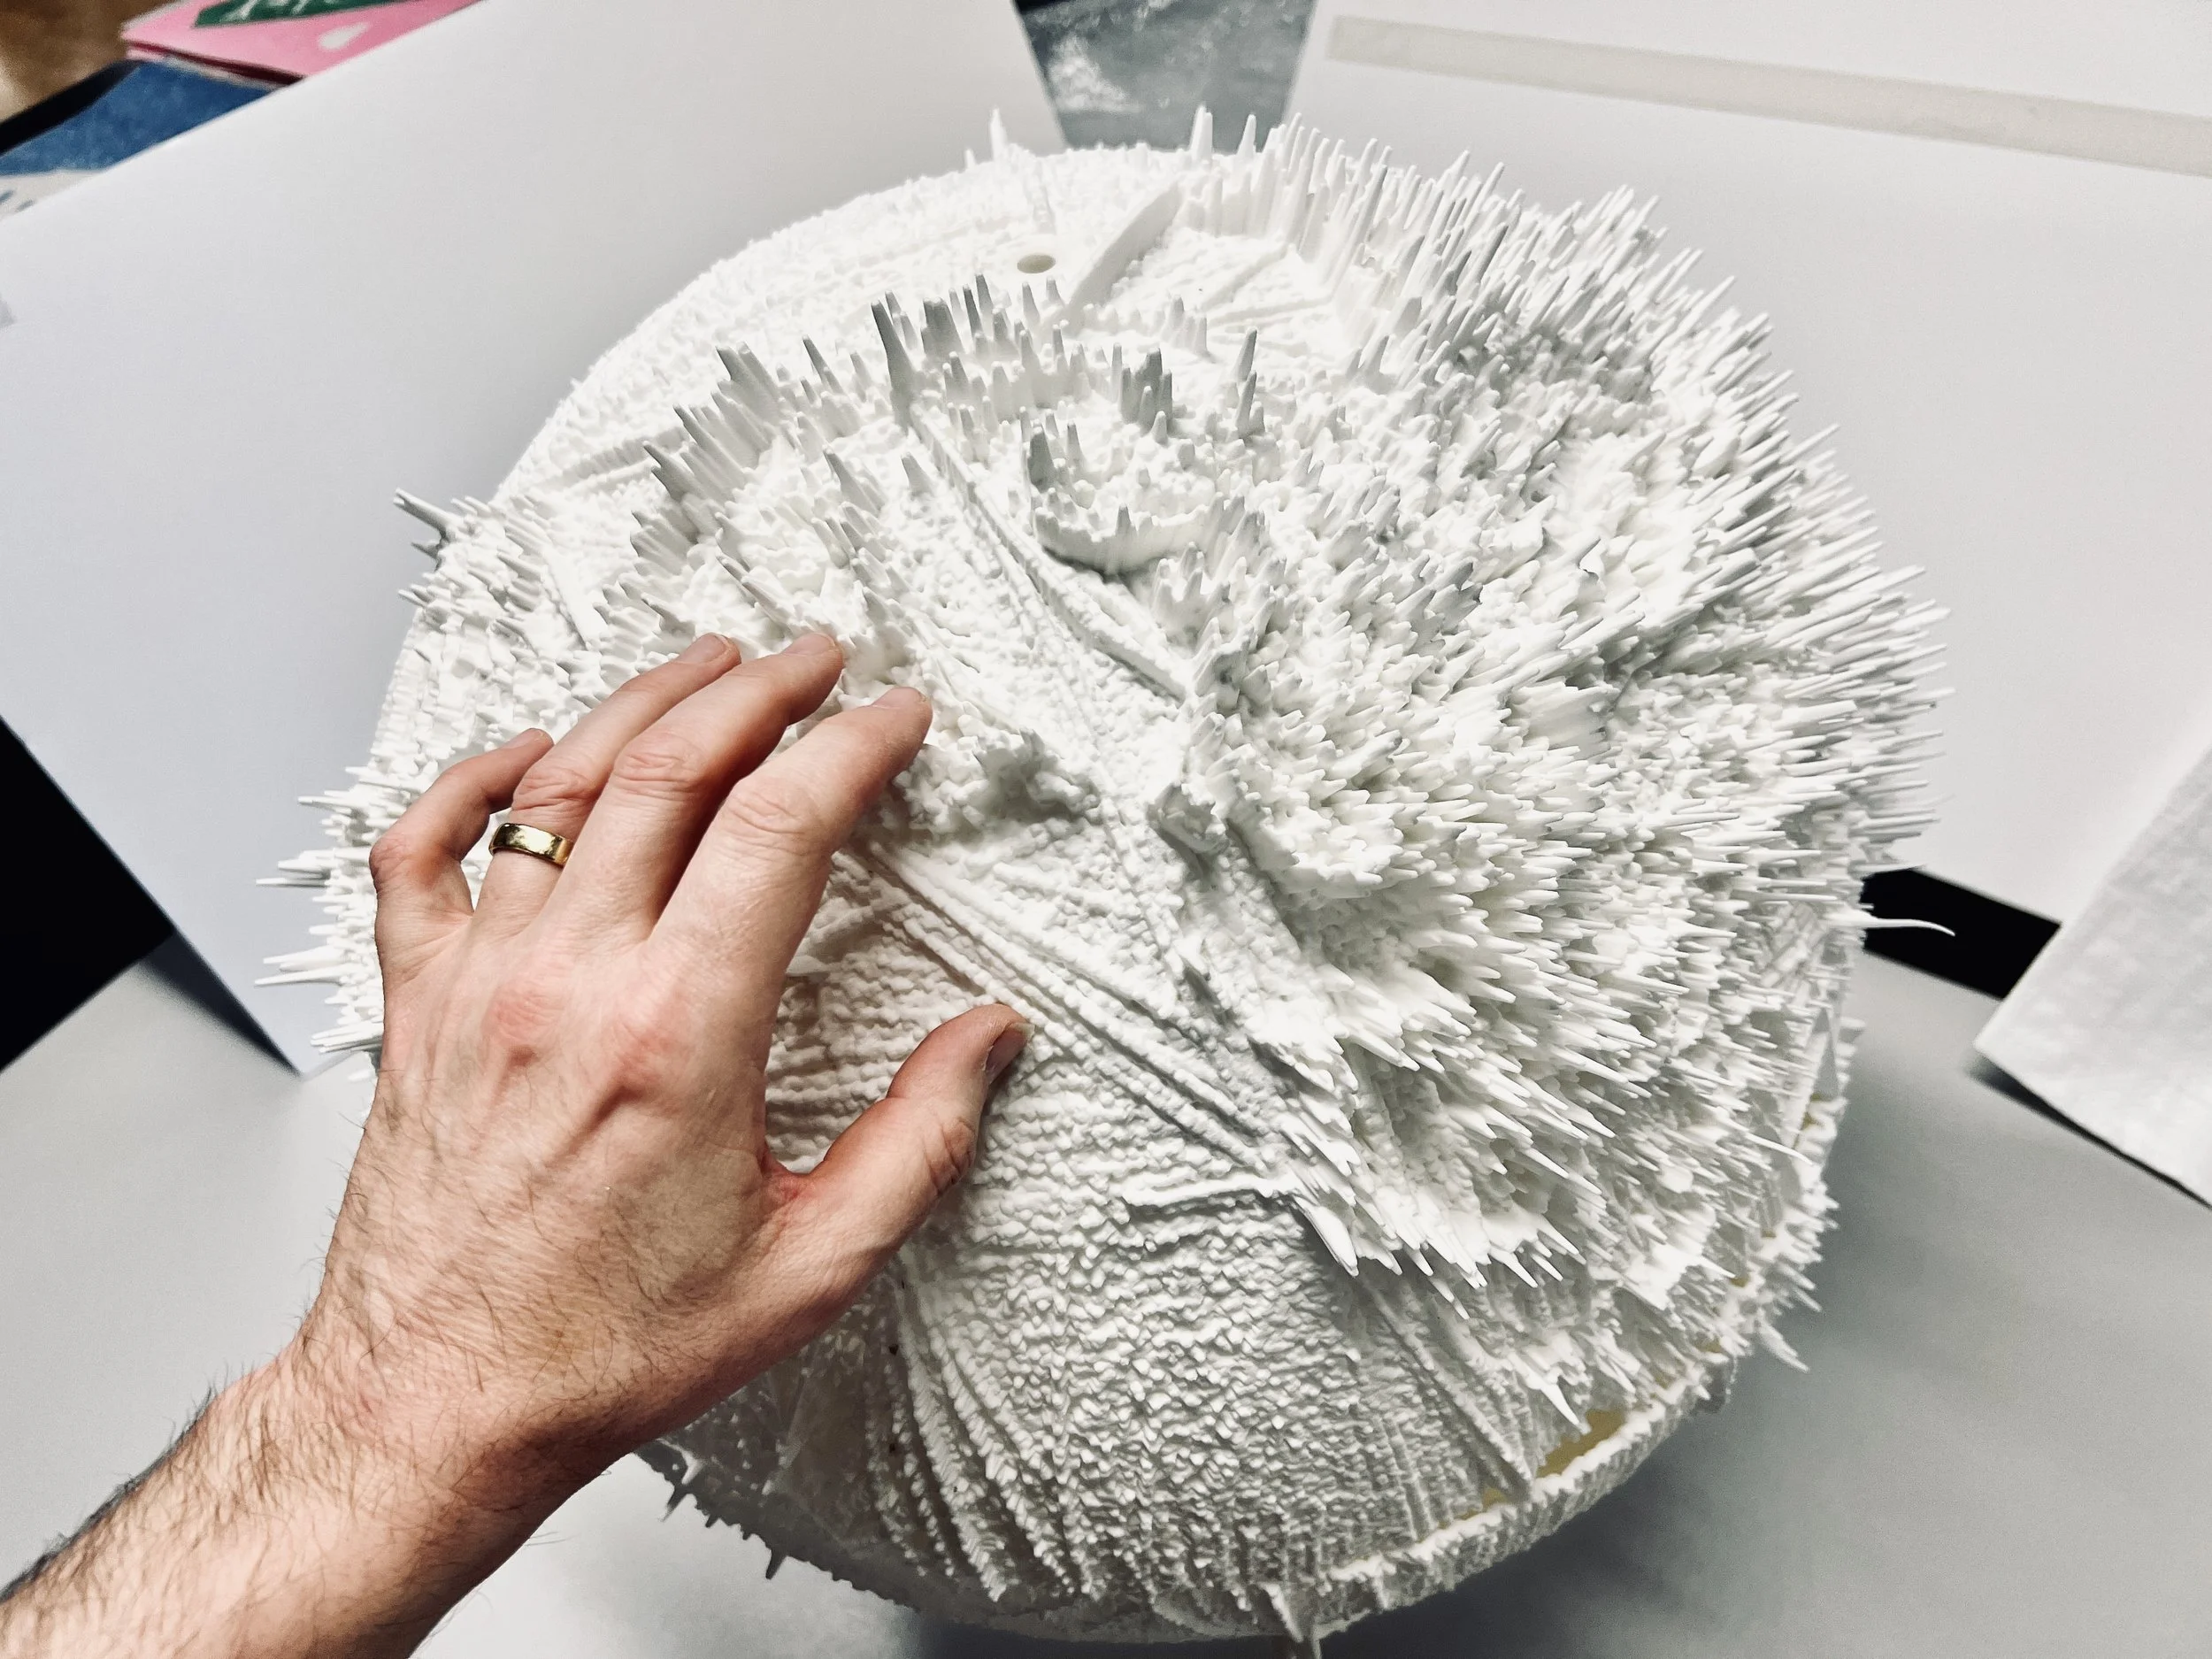
Physical climate data using EDGAR data set.
The Arctic is centre surrounded by historic carbon emissions with Antarctica at the periphery
Size 150 cm diameter., 10 cm height. Globe models 40cm diameter
Necrotopologies consist of models that extrude carbon data into three-dimensional maps that interweave the many sources of anthropogenic carbon production. Forms akin to crustal geologies emerge from this process describing bleak landscapes of scars, ridges, and archipelagos of carbon production. Data is mapped to a grid of geometric constructs and output as physical models using large format 3D printers. The models depict the locations, amounts and flows of carbon emissions resulting from the activity of the global economy since the 1970s to the present day. This includes fossil fuel extraction, energy usage, manufacturing, transportation, travel and food production.
The data derives from the Emissions Database for Global Atmospheric Research (EDGAR) which is used to inform the UN Framework Convention on Climate Change.
[Bottom]
The Carbon Chronicles
Guerrilla projection at Tate, and Houses of Parliament, 11th November 2021
Visualises the data that shows how the build-up of CO2 and other greenhouse gasses has radically altered the Earth’s atmosphere. The work maps from the industrial revolution to the present day the regions contributing most to the climate crisis, which can be traced through the stalagmite growths animating out from the different countries. Beginning with the UK in the 1750s, emissions from coal start enveloping the planet, other regions soon follow. By the late 1800s through to the current period, growing industrial and extraction activity in the Global North is responsible for 92% of CO2 with 8% coming from the Global South. The spread of CO2 described in the animation mirrors the wider historic processes of power distribution visited on poorer countries and shows that the atmosphere is as contested a space as the territories beneath it. MDL’s animation informs the need for equitable solutions to the climate crisis that are mindful of the historic consequences of carbon exploitation.
[Below]
Political Atmospherics
Visualisations of data from CMIP6 (the Coupled Model Intercomparison Project) showing emissions from forest fires.
3D prints of CO2 emissions girdling the Earth, data from ESM 2 Global Emissions models.
Various sizes.
Represent carbon plumes that are enveloping the atmosphere. In contrast to the models described above which maps the production, locations and types of carbon emissions, these models show how these emissions develop as gaseous plumes that are geo-forming the atmosphere. The data driving the animations is derived from Carbon Tracker an open-source CO2 climate model developed by National Oceanic and Atmospheric Administration (NOAA). The particular data sets used in the animation cover emissions from fossil fuel, agriculture, and forest fires covering a period from 2019 to the present date.
and
Little Earths
3D printed globes derived from ocean current and ice floe data. Science Centre Glasgow, Green Zone, COP26.
‘Little Earths’ are small 3D printed models produced from climate data that express and represent the fragility of the Earth and its environmental systems. The objects are made from sustainable plant-based filaments (including seaweed) and other recyclable materials. Little Earths are small enough to carry on an everyday basis but are fragile and require delicacy in their handling. We conceive them as talismans for our relationship to the planet and seek to engage people in a durational artwork that pervades and intervenes in their everyday lives as an act of mindful care. Participants will receive a certificate of ownership and will be asked to document their reflections as custodians in visual and textual forms.
Find out more about Tom’s work with Manifest Data Lab here.